Introduction
Today’s article continues the series covering my recent trip to the Athabasca oil sands around Fort McMurray, Alberta. This is an annual trip that the Canadian government hosts for energy journalists, and expenses for the trip were paid for by the Canadian government.
Previous articles in this series include:
- Oil Sands and the Environment – Part I
- Oil Sands and the Environment – Part II
- How Alberta’s Oil Sands are Produced
Today I want to discuss in more detail the two companies that we visited on this trip: Canadian Natural Resources Limited (NYSE: CNQ, TSE: CNQ) and Cenovus Energy (NYSE: CVE, TSE: CVE). I will detail the cost of oil sands production via the different methods these companies utilize, as well as the energy return on energy invested (EROEI) of extracting the bitumen.
Canadian Natural Resources
One of the visits we made on the trip was to Canadian Natural Resources’ (CNRL) Horizon Oil Sands Project. The project consists of surface oil sands mining, a bitumen extraction plant, and on-site bitumen upgrading that includes coking and hydrotreating operations. The product is sweet synthetic crude oil (SCO), as well as diesel, naphtha, and petroleum coke.
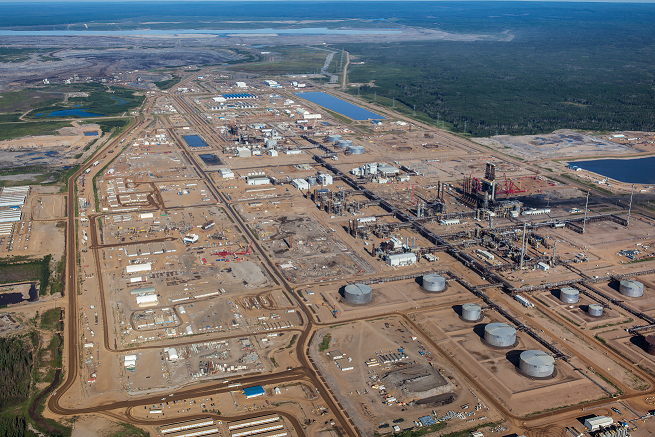
Aerial view of the Horizon oil sands facility. Source: Canadian Natural Resources Ltd.
The process for producing bitumen via surface mining was covered in detail in last week’s article. To review, the process consists of:
- Removal of the overburden (timber and 30-40 meters of peat, clay, and sand)
- Digging up the bitumen-laden ore and transporting it to the processing facility
- Mixing the ore with hot water to separate the bitumen from the sand
- Transporting the remaining sand and residual bitumen to the tailings ponds for further settling
- Upgrading the bitumen into synthetic crude oil (this is optional, but CNRL does upgrade at Horizon)
- Ultimate reclamation of the mining site and tailings ponds
My general observations were that this is an operation of enormous magnitude. The open pits were huge, as were the trucks to transport the ore. The trucks did kick up quite a bit of dust as they drove past my group at a frequent pace. Other than the dust, there wasn’t much smell unless you stood directly downwind of the ore processing facility.
Horizon Oil Sands’ leases are north of Fort McMurray in the Athabasca region. These leases are estimated to contain approximately 14.3 billion barrels of bitumen initially in place, with 2.9 billion barrels of proved and probable SCO reserves. CNRL estimates that 6 billion to 8 billion barrels are ultimately recoverable. Given the scale of the resource base, CNRL expects the mine and plant facilities to produce for decades without the production declines normally associated with conventional crude oil wells.
At present, the Horizon project has five expansion stages scheduled. Phase 1 aimed to deliver 110,000 bpd of fully upgraded, light, sweet, synthetic crude. That target was reached in Q3 2013, with a production rate of 112,000 bpd (a 16 percent year-over-year increase).
Phases 2 and 3 plan to boost output to 250,000 barrels per day, with potential for further expansion to 500,000 barrels per day. Production costs at Horizon are largely fixed, so production costs on a per barrel basis are projected to decline significantly when Phases 2 and 3 come on-stream. Currently the cost of production is in the $40/bbl range. Capital costs add another $10-$20/bbl, but the expected operating cost for the life of the mine is projected to decline to between $25 and $35 per barrel of SCO. Considering that the going rate for SCO over the past couple of years has been $90-$100/bbl, the project should be highly profitable for the company.
While the Horizon project is a key part of CNRL’s business, the company is involved in a number of other activities. It is the second largest independent natural gas producer in Canada, as well as the largest heavy oil producer in Canada. CNRL’s portfolio also includes in situ oil sands and natural gas liquids (NGLs), and assets in North America, the North Sea and offshore Africa.
In the most recent quarter the company produced a total of 1.2 billion cubic feet (bcf)/day of natural gas (down 2 percent year-over-year) and 509,000 bpd of crude oil and NGLs (up 8.5 percent YOY). Year-to-date earnings through Q3 2013 were $1.86 billion (Canadian), versus $1.54 billion for the same time period a year ago.
Besides CNRL, other companies involved in surface mining of oil sands include Suncor Energy (NYSE: SU, TSE: SU), Canadian Oil Sands (TSE: COS), and Imperial Oil (NYSE: IMO, TSE: IMO). The Muskeg River mine is a joint venture between Shell Canada (60 percent), Chevron Canada (20 percent), and Marathon Oil Canada (20 percent).
Cenovus Energy
Cenovus Energy was formed on Dec. 1, 2009 when Encana Corp. split into two companies: the oil company Cenovus Energy and the natural gas company Encana (NYSE: ECA, TSE: ECA). Since the split Cenovus shares have traded mostly higher — up nearly 60 percent at one point — while Encana shares have fallen nearly 70 percent as a result of low natural gas prices.
Cenovus was a pioneer in the Athabasca oil sands in utilizing steam assisted gravity drainage (SAGD). The technique has had a dramatic impact on Canada’s oil reserves by enabling the production of oil sands that were formerly too expensive to produce. One might say that Canada is experiencing a “SAGD revolution” analogous to the fracking revolution that has boosted oil production in the US. This process was also explained in some detail in last week’s column, but consists of:
- Drilling a pair of horizontal wells, one about 5 meters above the other
- Extracting brackish ground water and converting that to steam
- Injecting steam into the upper well for months to heat up the bitumen
- Pumping the hot liquid bitumen from the lower well (steam injection continues during most of the well’s lifetime)
- Separating the returned water from the bitumen and reusing the water in the process
Cenovus is different from CNRL in that it doesn’t upgrade the bitumen produced on site. It is typically transported to a refinery and refined into finished products like diesel, gasoline, and jet fuel. Since bitumen is a solid at room temperature, it has to be diluted or kept warm to transport. Transportation can be done via a heated rail car, but mostly the bitumen is mixed with a diluent so it flows freely, and then transported by pipeline or rail.
Cenovus has an interest in two heavy oil refineries through a partnership with Phillips 66 (NYSE: PSX), which enables it to upgrade the oil to finished products. In return for the 50 percent ownership in the refineries – Wood River, located in Illinois, and Borger, located in Texas — ConocoPhillips (NYSE: COP) was granted a 50 percent stake in the Cenovus projects at Christina Lake (the site I visited) and Foster Creek.
Cenovus has been one of the most innovative companies in the heavy oil space. Technological innovations such as injecting butane along with steam and the company’s Wedge Well™ technology, which accesses additional bitumen by adding a single horizontal well between a pair of SAGD wells, have driven down costs while consuming less energy and increasing resource recovery to a range of 60 to 70 percent.
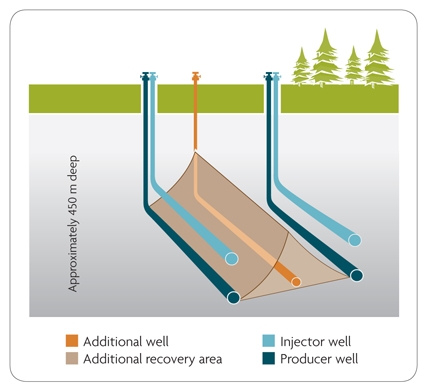
How Wedge Well™ technology works. Source: Cenovus
Cenovus reported costs that were much lower than I expected. At the Christina Lake site I visited, their cost of production — which factors in taxes plus a 9 percent return — was cited at $35-$45/bbl. This is cheaper than the overall cost to produce bitumen via surface mining at CNRL, but Cenovus’ finished product is bitumen and not the higher value synthetic crude oil that CNRL produces.
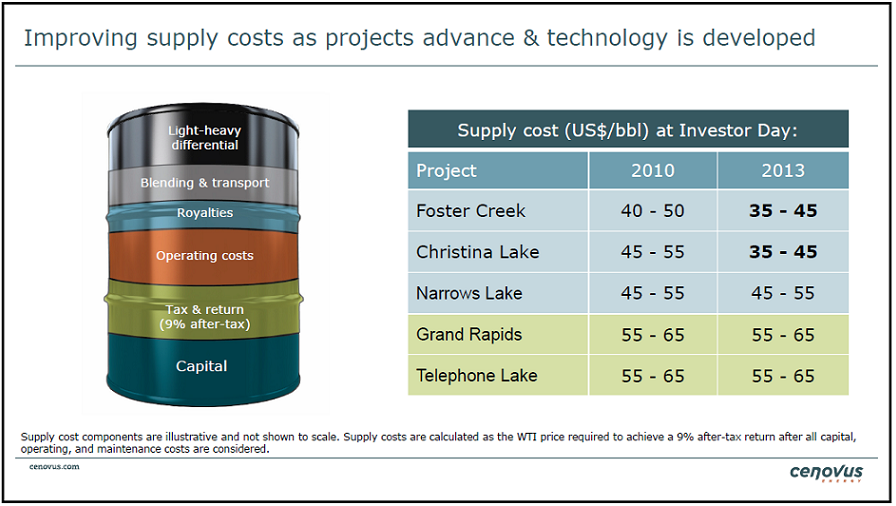 Cenovus cost of bitumen production. Source: Cenovus Investor Presentation
However, their costs have been declining as they climbed the learning curve. Between 2010 and 2013 they reported that they had reduced costs by $5-$10/bbl. But they expect that their emerging bitumen projects at Grand Rapids and Telephone Lake will be around $20/bbl more to produce than their currently-producing projects. Because Canadian heavy oil has historically traded at a $30-$40/bbl discount to West Texas Intermediate (WTI) crude due to logistical constraints, these emerging bitumen projects may require WTI prices above $90/bbl to be economical.
According to Cenovus, there are no tax incentives available that are specific to oil sands production. I took that to mean that there may be industry-wide tax breaks, but they are the same for conventional oil production and for bitumen production.
In 2012, Cenovus averaged 165,000 bpd of oil and natural gas liquids, a 23 percent increase over 2011. The company’s strategic plan aims to increase net crude oil production to 500,000 bpd by the end of 2021. Natural gas production fell by 9 percent to 594 million cubic feet per day as the company focused more on liquids production. The company’s total proved reserves of oil, natural gas, and NGLs increased 12 percent in 2012 to 2.2 billion barrels.
Energy Return on Energy Invested
The amount of energy required to produce bitumen has been a hot topic for many years. Some argue that these projects are a poor way to use energy, because the energy return on energy invested (EROEI) is ~ 3:1 (which would mean it takes 1 BTU of energy input to produce 3 BTUs of bitumen output).
This is a simplistic picture, and only partially correct. First, as I explained in “How Not to Use EROEI“, the EROEI of a process doesn’t necessarily say much about the economics of the process. If you are using cheap energy inputs to produce a higher value product, then a low EROEI might be perfectly acceptable from an economic point of view. In the case of SAGD, they are using cheap natural gas to produce much more valuable crude oil. Thus, in this case a low EROEI itself says nothing about the economic viability of the process.
What a low EROEI does indicate is that fossil fuel resources are being depleted at a faster rate; the lower the EROEI the faster the depletion. Thus, lower EROEI projects are generally worse from an environmental/greenhouse gas emissions point of view.
The biggest problem with the low EROEI claims is that there is great variation across the industry. To illustrate, consider that in any industry, competitive analyses are often done by 3rd parties. (I have personally been involved in such analyses). The organization doing the evaluating will be given access to data from participating companies to provide an overall analysis of particular metrics. They share the results with the participating companies, but each company is only allowed to see their rank among the other companies. In other words, in the graphic below Cenovus knows which bars belong to them, and they know which companies participated, but they don’t know which other bars belong to which companies:
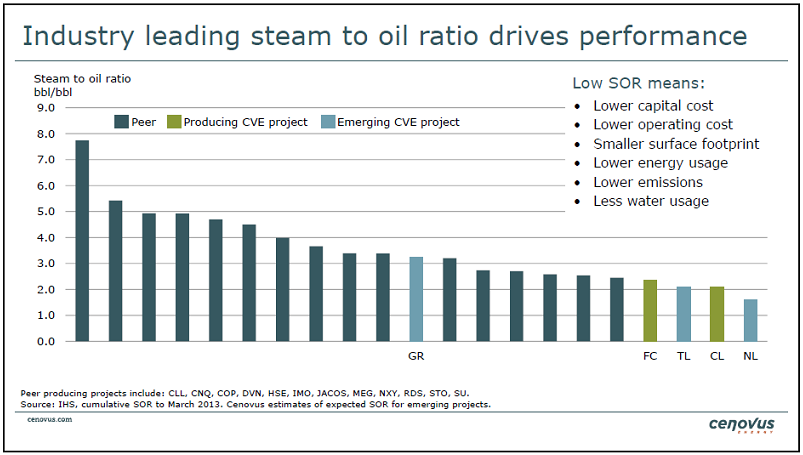 Steam to Oil Ratio. Source: Cenovus Investor Presentation
So we can see that in this analysis of data collected by IHS CERA, the four lowest “steam to oil ratios” — a measure of the relative indication of how much energy is being used — are found in four Cenovus projects. FC, TL, CL, and NL are Foster Creek, Telephone Lake, Christina Lake, and Narrows Lake. Their Grand Rapids (GR) project is in the middle of the pack.
But how does a “steam to oil ratio” (SOR) translate to EROEI? I spent a lot of time going back and forth with Cenovus on this issue. As an engineer, a “barrel of steam” really has no absolute meaning, as it can have differing energy content depending on the temperature and pressure of the steam. So I asked for actual BTUs of energy to produce a barrel of steam, so that I could make relative comparisons. After several follow-up email exchanges and a phone call, here is what I was told by Brett Harris, a Cenovus spokesperson:
“As of the second quarter of 2012, we were using approximately 840 cubic feet of natural gas to produce 1 barrel of oil. On a BTU basis, that’s approximately 856,800 BTUs of natural gas to produce approximately 5.8 million BTUs worth of oil, which is a ratio of about 1 to 6.8.
Unfortunately, I don’t have the electricity input for 2012. The last year for which I have fully calculated numbers was 2008. In 2008, at our Christina Lake operations, electricity and diesel accounted for about 5% of the total energy input to create a barrel of oil. Natural gas accounted for the remaining 95%. At the time, our all in energy ratio to produce a barrel of oil was about 1 to 6.3. (I believe that has improved since then, but I don’t have the electricity numbers to calculate a more recent all in number for you).”
So if I use the 2012 ratio of 840 cubic feet of natural gas to produce a barrel of oil, add another 5% to account for diesel and gasoline, I arrive at about 900,000 BTUs of energy to produce 5.8 million BTUs of oil. That results in an EROEI for Cenovus’ bitumen production of 6.4 to 1. The EROEI has been improving over time as they have learned what works well and what doesn’t, and it is approaching the lower range of conventional oil production.
But note in the graphic that while the SOR for most Cenovus projects is down in the 2 to 1 ratio (2.1 according to the graphic below), one of their peers uses a lot more energy at ~7.8 to 1 for the SOR. While the comparison isn’t perfect, because some companies may define a “barrel of steam” in slightly different ways, we can make a rough estimate of the EROEI for the industry laggards.
If we assume that 900,000 BTUs of energy inputs are approximately the equivalent of a 2.1 to 1 SOR, then a 7.8 SOR would be approximately 3.3 million BTUs of inputs to produce 5.8 million BTUs of oil. (That may be a slight overestimate as that also assumes that the laggards are less efficient with electricity and diesel; if we assume that their electricity and diesel efficiency is the same as that of Cenovus, I come up with 3.2 million BTUs of input).
That means for the worst in class, the EROEI is only about 1.8 to 1 (5.8 million output for 3.3 million input). If these were fungible inputs and outputs — for example, if they had to cannibalize some of their oil to produce the energy for the process — this wouldn’t be economically viable for that particular project. Perhaps their process is still economical with cheap natural gas inputs and oil outputs, but the very existence of this process means that those low-ball EROEIs regarding oil sands production have some truth to them.
While the one company with an SOR of ~7.8 is a clear outlier, there are a number of companies operating in the 4 to 5 range for SOR. Assuming an average of 4.5 for the SOR and repeating the earlier exercise, I arrive at an EROEI for these companies of 3 to 1. So it would appear that the vast majority of oil sands operators are operating down in the 3 to 1 range, with the very important caveat that it is possible to have an EROEI of double that — as Cenovus has demonstrated.
How does this compare to surface mining? According to the following graphic, Cenovus’ SAGD process is better than the average surface mining process, which itself looks to have an SOR of about 3 to 1. That would make the EROEI of surface mining of bitumen about 4.3 to 1 — itself better than the average in situ process.
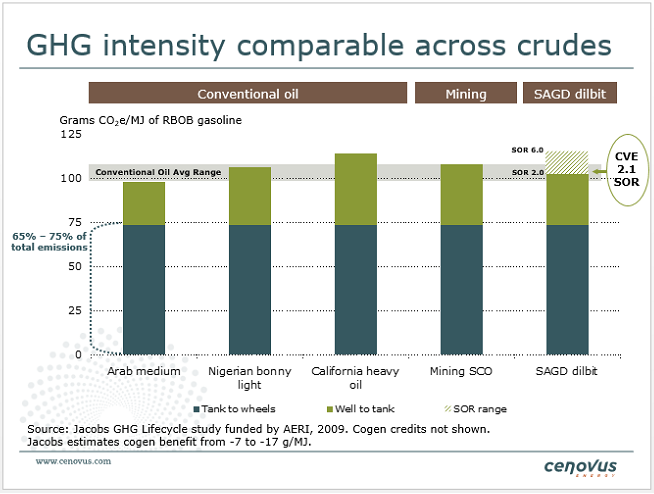
GHG Intensity Across Comparable Crudes. Source: Cenovus Investor Presentation
One other item of interest from that graphic is that it indicates that Cenovus’ bitumen production actually has a better energy return from well-to-tank than Nigerian light oil or California heavy oil. This would take into account the production, transport, and refining of the oil. Saudi Arabian medium crude has the lowest energy inputs on the graphic, indicating it has the highest EROEI. (Note that in the previous EROEI calculations, the refining step isn’t included; refining to finished products requires another 500,000 to 600,000 BTUs of energy input per barrel of finished product).
In next week’s article I will conclude the series on the Athabasca oil sands by examining the logistical issues of getting the oil sands to market, including the impact of the Keystone XL decision (regardless of which way it goes).