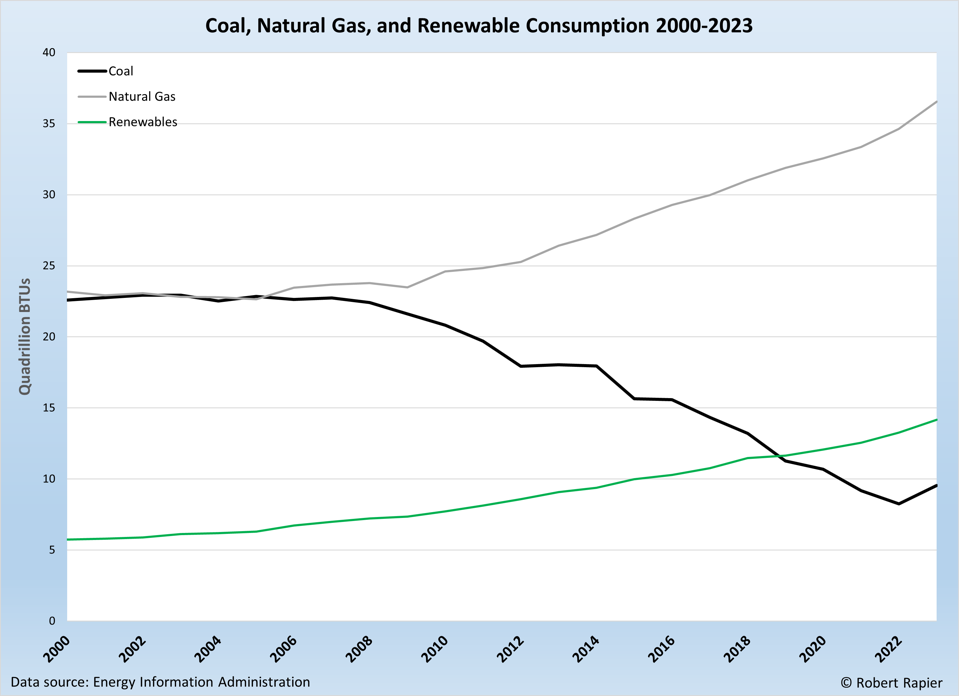
The U.S. energy landscape has undergone a remarkable transformation since 2000. The changes reflect broader economic, technological, and policy trends that have influenced the nation’s energy mix.
One area that has experience significant upheaval is the consumption patterns of coal, natural gas, and renewables. This is the story of that transformation.
Early 2000s: Dominance of Coal
At the beginning of the 21st century, coal was the dominant energy source for electricity generation in the United States. In 2000, coal consumption stood at 22.6 quadrillion British thermal units (BTUs), reflecting its widespread use in power plants across the country. This was primarily a reflection of coal’s relatively low cost and abundance in the U.S.
Natural gas consumption was also substantial at 23.3 quadrillion BTUs, but it was primarily used for heating and industrial processes. However, it would soon be a rapidly growing fuel for electricity generation. Renewable energy, including hydroelectric, wind, solar, and biomass, contributed a modest 5.7 quadrillion BTUs.
Mid-2000s: Rise of Natural Gas
The mid-2000s saw a notable increase in natural gas consumption, driven by advances in hydraulic fracturing and horizontal drilling techniques that unlocked vast reserves of shale gas. By 2005, natural gas consumption stood at 22.7 quadrillion BTUs, but it was on the verge of breaking out.
Coal consumption remained relatively stable, peaking slightly in the mid-2000s before beginning a gradual decline. Renewables started to gain traction, largely due to increased investments in wind and solar energy.
Late 2000s and Early 2010s: Shift Toward Cleaner Energy
The late 2000s and early 2010s marked a significant shift towards cleaner energy sources. This period saw a rapid decline in coal consumption, dropping to 20.8 quadrillion BTUs by 2010, as environmental regulations tightened, and the economic advantages of natural gas became more apparent.

Natural gas consumption reached 24.7 quadrillion BTUs in 2010, benefiting from its lower carbon emissions and cost-effectiveness. Renewable energy continued its upward trajectory, reaching 7.6 quadrillion BTUs in 2010, spurred by federal and state incentives, technological advancements, and decreasing costs.
Mid-2010s: Accelerated Decline of Coal and Rise of Renewables
The trend towards cleaner energy sources accelerated in the mid-2010s. By 2015, coal consumption had fallen sharply to 15.7 quadrillion BTUs, while natural gas consumption continued to climb, reaching 28.3 quadrillion BTUs. Renewables saw significant growth, with consumption rising to 10.0 quadrillion BTUs, driven by substantial increases in wind and solar power capacity.
Late 2010s to Early 2020s: Dominance of Natural Gas and Renewables
The late 2010s to early 2020s solidified the dominance of natural gas and renewables in the U.S. energy mix. By 2020, coal consumption had plummeted to 10.7 quadrillion BTUs, reflecting the ongoing decommissioning of coal-fired power plants and a shift towards cleaner energy.
Natural gas consumption reached 32.6 quadrillion BTUs in 2020. Natural gas played a role both as firm power (power on demand), in addition to a role in balancing intermittent renewable energy sources.
Renewables saw remarkable growth, with consumption reaching 12.1 quadrillion BTUs in 2020, highlighting the significant contributions of wind, solar, and biomass energy.
Recent Trends: Continued Growth of Natural Gas and Renewables
In 2023, coal consumption bounced back a bit, while natural gas consumption grew to a record 36.5 quadrillion BTUs. Renewable energy consumption reached a record 14.7 quadrillion BTUs in 2023, reflecting ongoing investments in renewable energy infrastructure and the increasing role of wind and solar power in the national energy grid.
Conclusions
The period from 2000 to 2023 has seen a dramatic transformation in the U.S. energy landscape. Coal consumption declined by 13.0 quadrillion BTUs, while natural gas consumption increased by 13.4 quadrillion BTUs. Renewable consumption increased by 8.4 quadrillion BTUs over that period.
However, it should be noted that these comparisons are not apples-to-apples. When coal or natural gas are burned for power, most of the energy (60% to 70%) is lost in the conversion to electricity as heat. However, that is not the case for renewables. Thus, it can be said that a BTU of coal or natural gas consumption is not directly comparable to a BTU of renewable energy consumption when electricity is the measure being discussed.
On the other hand, renewable energy is not firm power. Natural gas can be used to completely replace a coal-fired power plant. Renewables are better suited to serve marginal demand in a decentralized fashion. As a result, renewables and natural gas have worked well together to cause the massive decline in coal consumption this century.
These trends are expected to continue as technological advancements, economic factors, and policy initiatives drive further efforts to reduce carbon emissions. The U.S. energy sector is poised for a future where renewables play a central role, supported by natural gas as a flexible and reliable energy source.
Follow Robert Rapier on Twitter, LinkedIn, or Facebook