Note: This post will be going up at The Oil Drum in the morning. For viewers of this blog, you get to see it first. This is my response to geologist Jeffrey Brown’s (alias westexas) post on whether world oil export numbers signal that world oil production has peaked.
First of all, while I kept the title consistent with Jeffrey’s original, I consider it to be a misnomer. I do not intend to debate the timing of Peak Oil. Some have misunderstood my long-running debate with Jeffrey to be a quibble about the timing of the peak. That is not the case. Yes, in my opinion Peak Oil is at least 3 years out. But that opinion is based on some things I can’t discuss, so I have indicated that I will not debate the matter.
Jeffrey and I agree on many things. We agree that some sort of revenue-neutral fossil fuel tax is needed to reign in our energy usage and encourage alternatives with low fossil-fuel inputs. We agree that transportation electrification should be a priority. We agree that once Peak Oil does occur, there will be an export crisis. We agree that regardless of whether the date of Peak Oil is today, or 5 years from now, we should have already gotten started on a major effort at moving away from fossil fuels. (Incidentally, even though a peak in the near-term is still a minority view, Global Warming has an overwhelming scientific consensus. So, if we can’t make the case to move away from fossil fuels as a result of Peak Oil, there is still the need to do so due to Global Warming.)
That’s an end to my digression, and now I will address the issue on which we disagree. First, I want to make it clear that I respect Jeffrey a great deal. I have learned much from his work, and I consider his contributions to be valuable. But I disagree with his interpretation of the export data. Jeffrey did make a prediction that we would see declining exports this year, and he predicted that this was because of a production peak in some of the major exporting countries.
Some of you know that I have a science background. I was halfway through my chemistry Ph.D. before I decided the job prospects looked better as a chemical engineer. That scientific training helped foster my skepticism, a trait I have had since I was very young. It reinforced for me that theories and hypotheses need to be backed up with solid, objective evidence, and it made me a stickler for interpreting data carefully. Metrics need to be consistent. More important than seeing predictions fulfilled is an understanding of the mechanism by which they are fulfilled. A prediction can be fulfilled, and yet the underlying mechanism could be in error.
This gets to the heart of my objection. I want the mainstream media, the politicians, and the public to listen to us and to understand the gravity of the situation we face. In order to gain credibility, we have to make very sound scientific arguments. Peer review amongst ourselves should be taken very seriously. If we don’t police ourselves, then the media will do it for us. If we haven’t done our homework we will lose credibility, the very thing we are trying to gain. When we formulate our arguments we need to put ourselves in the critics’ seats, ask what the counterarguments will be, and then make sure we can address them. If we can’t, we need to improve our argument.
So, when claims like “the net export crisis is upon us” are made, we need to ask some tough questions. We need to do some peer review. If we don’t, and the argument turns out to be wrong, we will lose some credibility as a group. We will have cried wolf. We can’t afford to cry wolf, because then we will have more trouble convincing people that the wolf is really coming.
Why Were Imports Down? Or Were Imports Down?
Jeffrey’s prediction, made here on January 27th, was that “these factors [one of which was Saudi Arabia on the verge of a permanent and irreversible decline] could interact this year to produce an unprecedented–and probably permanent–net oil export crisis.”
As stated here, he is making his case against a “12/30/05 index number of 12.8 mbpd.” Imports into the U.S. did indeed start to fall in the first quarter. By March imports had dropped to just under 12 million bpd.
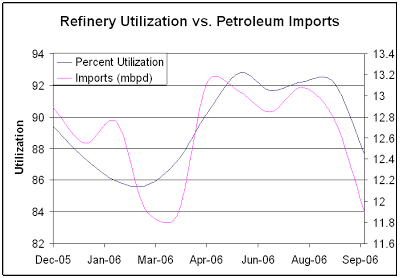
After the first quarter, much was said about this being evidence of the beginning of the permanent export crisis. However, as I pointed out at the time, refinery utilization during this time period was falling. I reiterated this point a week later. In December, refinery utilization averaged 89.4%. In March, refinery utilization was down to 85.7%. Refineries that are down for turnarounds will not be purchasing crude oil. The demand for imports drops. Turnarounds are planned months in advance, so it was well known by the refineries that they would not need oil during this time period. I think in this case a picture is worth well more than a thousand words.
Note what happened when the refineries came back up from their turnarounds. Utilization started picking back up in April, and reached a peak of 93.2% in June. Throughout the summer, imports were back up – well higher than the December 2005 benchmark – and exceeded 13 million bpd. As you can see, there is a strong correlation between the refinery utilization numbers and imports. In fact, I did a statistical analysis with Excel, and the correlation coefficient for imports and refinery utilization over the past year was 0.72. Therefore, the definitive answer as to why exports were falling in the spring is simply that refiners were in full turnaround mode. The first quarter wasn’t about a permanent export crisis, even though at that time falling exports were used as evidence supporting the predictions.
But of course the U.S. is not the world. So, what was happening in other countries as imports started climbing in the U.S.? Were we outbidding other countries for dwindling available exports?
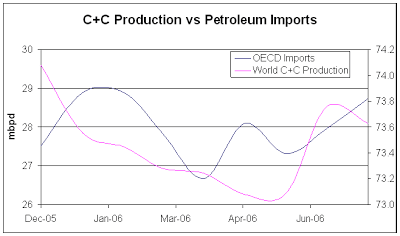
To my knowledge, there are no data on total exports. But we can account for a significant fraction by looking at total OECD net imports. Total OECD net imports in December 2005 averaged 27.52 million bpd. In January, imports did climb to 28.89 million bpd, and then started to fall as refinery turnaround season began. During the high driving season months in the U.S. (May-Aug.), when U.S. imports had climbed back up, total OECD net imports averaged 28.0 million bpd.
Note that C+C has a decent correlation (although with a time-offset) to OECD imports. That total imports were down slightly from January is not surprising given the high prices over the summer. But summer OECD imports were actually higher than the December baseline for making the import case. I would also add that total OECD stocks went up by almost 100,000 barrels during the same time period, implying that demand was softening and therefore the imports weren’t needed.
I would note in addition that Saudi oil production started dropping in January just as OECD imports started to fall. We all know the story that Saudi Arabia’s oil minister commented that they were having trouble finding buyers at the higher production volumes: “It’s not just heavy oil. Even light oil is having problems.” This prompted much speculation that he was lying to cover up the fact that oil production in Saudi had peaked.
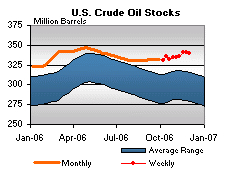
Note the graph of crude stocks during this time:
As you see, their story is consistent with inventory numbers. From January to April stocks were rising, as exports were falling. Doesn’t this mean that the exports weren’t needed, if inventories were climbing despite falling exports? This was one of the reasons given for Saudi cutting production: Inventories were full. Well, in the U.S., we can certainly conclude that this is fully consistent with their claims.
Also, as I have noted several times, if they say they have product for sale, and someone needs it, they are going to get phone calls. Just imagine if you claimed to have something for sale that was in demand. Don’t you think people who need the item are going to call you? What are you going to tell them when they do if you don’t really have the item?
What about Prices?
Again, the OECD is not the world, although it is most of the developed world. So, what of the theory that prices were being bid up, and therefore imports were being taken from 3rd world countries? Without question there has been demand destruction due to high prices. The EIA’s World Oil Balance spreadsheet shows that demand in the second quarter dropped off as prices spiked up (again consistent with the Saudi claim). Demand was down by 2 million bpd – at 83.15 million bpd – over the previous 2 quarters in which demand had averaged over 85 million bpd. Of course oil prices had spiked over $10/barrel over this period of time. So, did prices spike because product was scarce? Did prices spike because demand was high? Was it fear and speculation? Or was it a combination of factors?
Those questions are difficult to answer definitively. Hurricane Katrina really shook up the oil markets by exposing just how little excess capacity presently exists in both oil production and refining capacity. A few short years ago, several million barrels of spare capacity were available. But by the time demand reached 85 million bpd, there was little excess capacity. This makes the markets nervous, and so geopolitical events have a disproportionate impact on oil prices.
So, what happened in the first quarter that might have caused oil prices to rise? In January, militants in Nigeria blew up some pipelines taking 220,000 barrels off the import market. At the same time, the Iranian president was making lot of threats which in my opinion were designed to keep oil prices high and help bring money into Iran. Shell decided to evacuate some workers in Nigeria during the turmoil, which prompted the Times Online to report on January 16, 2006:
The withdrawal, combined with Iran’s threats to force up prices in response to threatened sanctions over its nuclear programme, prompted a rise in the cost of oil, up 93 cents to $63.18 a barrel this morning.
In February, militants in Nigeria launched their “dark February” campaign designed to make foreign oil interests leave the country. By March, exports from Nigeria were down 300,000 barrels a day over the 4th quarter of 2005. This was significant given Hurricane Katrina had taken hundreds of thousands of barrels of daily production offline. In February 2006, 362,796 bpd were still shut-in. Shell’s Mars platform alone produced 140,000 bpd of oil production. This production wouldn’t start to come back online until late May 2006.
Those geopolitical events, combined with lingering production upsets from Hurricane Katrina, drove oil prices to record levels. There was a threat from Iran, and actual production gone from Nigeria and the Gulf of Mexico. In a nervous market with little excess oil production capacity, one doesn’t have to appeal to an oil production peak in order to explain why oil prices shot up.
Couldn’t This still be Peak Oil?
I said I won’t try to argue for a specific date on the peak, but I will argue that the import/price data are poor arguments in favor of calling the peak. This is not the case you want to present to the media. They will poke holes in it, and then if/when imports do climb back up, credibility is shot.
Back in the spring, when some others were calling December “the peak”, I predicted that as long as demand stayed high we would set new production records in the summer. Well, demand did soften, but the EIA estimates that July 2006 will be higher than December’s 84.5 million bpd at 85.2 million bpd. They also project August to be over 85 million bpd. The previous total liquids record was in May 2005 at 85.2 million bpd. (Stuart Staniford also discusses this issue here).
There is a lot of debate about total liquids, and whether it is an appropriate metric. There are two primary problems with total liquids. First, some production is double-counted. If liquid fuels are used in the production of ethanol – and they are – then the production gets counted twice. However, the majority input into ethanol is natural gas. In that case, even though the energy balance might be poor, you have a legitimate addition to total liquids, albeit an addition with a lower energy value. Second, total liquids include items like orimulsion which isn’t a replacement for liquid fuels. On the other hand, if orimulsion is used in an application that displaces liquid fuels use, then you again have a legitimate addition to total liquids.
Without question the “purer” metric for predicting peak oil is crude plus condensate (C+C). December in fact remains the highest month on record for C+C at 74.1 million bpd. This summer, we reached an estimated 73.8 million bpd in August. However, a metric somewhere in between – like net total liquids – would be the most appropriate measure. You can’t use just C+C because that overlooks the portion of ethanol that is a legitimate net addition to liquid fuels. But you can’t use total liquids because it double-counts on the liquid petroleum inputs into ethanol (as an example). What is needed is a net total liquids metric that has subtracted out the double-dips. To my knowledge no such metric exists, and for now we have to live with the imperfect system we have. As it stands, the best we can say is that it is possible that a new record was achieved during the summer for net total liquids.
Conclusions
My intention here is not to “win” a debate. Jeffrey and I are in fact on the same side. My purpose is always to learn, educate, and generate food for thought. As I stated in the opening segment, I believe that credibility is crucial. However, to build credibility we have to build a strong case and be careful with data interpretation. If I argue that there is a problem because imports are down, I need to be prepared to answer the critics. I need to be sure that my case is objective and consistent.
If I use falling exports and rising prices as evidence that my prediction was accurate, then rising exports and falling prices should be evidence that the prediction was inaccurate. If I come up with some new reasoning that explains the latter, I must be willing to apply this reasoning to the former. Otherwise, the reasoning is ad hoc. If I say that A is like B because both are blue, but then I say A is not like C because C is heavy, this is an example of ad hoc reasoning. I can’t use one metric in one case and a different metric in another case. When you do this, you make it impossible to falsify your argument. And an argument that is impossible to falsify is not an argument that will withstand scientific scrutiny.
As always, I invite comments, questions, or corrections. If Jeffrey wishes to continue for another round, I would be in favor of that. In that case, I would presume he would have a response up in a week or so.


RR–Whether you are right or Jeffrey (westexas) is right is totally irrelevant because what counts is the date when society (civilization) acknowledges Global PO and not the date on which it technically happens. In that regard it is somewhat surprising that Daniel Yergin (CERA) is claiming that energy innovation is “bubbling” well ahead of recognition date. While on the one hand the CERA folk are saying the “undulating plateaus” will stretch out for many decades before production declines begin, they are saying that the innovation markets have already recognized the oncoming declines and are mitigating the effects through the early “bubbling” effect. On the other hand, you and Jeffrey are saying almost no one (except us Peak Freaks) recognizes the coming PO crisis and the issue is that of accurately predicting the exact technical moment.
I will direct your attention back to something from this essay:
Some have misunderstood my long-running debate with Jeffrey to be a quibble about the timing of the peak. That is not the case.
The point is, if you lose credibility by using poor evidence, you will lose the ability to convince people that there is a problem. That is my main concern.
Right you are .. I suspect I’m not the only one who “saw” those words but did not absorb them. Also I agree that “economic” data is no way to determine when actual peak happens. We humans arbitrarily “value” things. One day tulips are super valuable and the next day dot.com companies with no business model are super valuable. It’s no different with oil prices.