In the previous article, I reviewed gasoline prices under the past four presidents. I only went back that far because gasoline prices were pretty stable prior to 2000.
Today, I want to look at the evolution of oil production over the past 120 years. But I want to focus on oil production since 1970, highlighting the periods of the largest gains and declines.
From 1900 to 1920, the U.S. oil industry slowly increased production. Starting in about 1920, that production rate accelerated, and growth was fairly steady right up until 1970. There were a few periods of decline between 1920 and 1970, but for the most part oil production grew during those 50 years by an average of 170,000 barrels per day (BPD) each year.
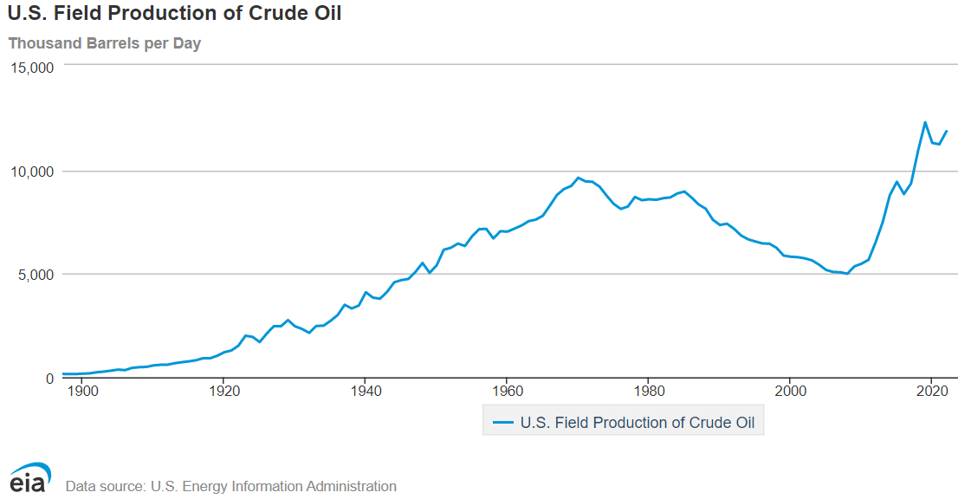
Richard Nixon was inaugurated as the 37th president on January 20, 1969. In 1970, U.S. oil production began the first substantial decline in history. By the time Nixon left office in August 1974, production oil had declined by about 200,000 BPD from where it was when he entered office, but it was down 1.3 million BPD from its November 1970 peak of 10.04 million BPD. (Source).
Oil production continued to decline for the next 35 years. The decline was fairly steady until the early 2000s, but then the decline flattened.
The reason the decline began to slow was hydraulic fracturing was being combined with horizontal drilling to usher in the shale oil boom. The techniques had already been used on natural gas, and gas production had turned upward as a result. Many of these important developments took place during George W. Bush’s presidency.
But the real rewards would first be seen during President Obama’s terms. After oil production turned upward in 2009 — President Obama’s first year in office — over the next decade it would climb at the highest rate in U.S. history.
During President George W. Bush’s last year in office, U.S. oil production was 5.0 million BPD. By the end of President Obama’s first term, that had climbed to more than 7 million BPD.
By the third year of Obama’s second term, U.S. oil production had nearly doubled to 9.7 million BPD. However, a price war with OPEC caused oil prices to crash and oil production to subsequently decline during Obama’s fourth year. Nevertheless, from the beginning of Obama’s first term to the end of his second term, U.S. oil production increased by 3.7 million BPD (but at its high point, it was up 4.5 million BPD from his inauguration).
As President Trump came into office in 2017 — and oil prices began to recover from the devastating price war with OPEC — oil production began to rise again. Just before the Covid-19 pandemic hit the U.S., oil production had reached 13.0 million BPD, a monthly increase of 4.1 million BPD from Trump’s inauguration month.
This increase marks the greatest single term increase during any U.S. presidency. But Covid-19 would ultimately crash oil prices, in turn causing oil production to plummet by 3 million BPD. That marks the largest monthly oil production decline within a presidential term.
Oil production recovered somewhat by the end of Trump’s presidency. During Trump’s last month in office, production had recovered to 11.1 million BPD, which was still 2.2 million BPD higher than during his inauguration month.
Here’s how it all looks by each term. I measured the average annual production increase or decrease during each president’s term by subtracting the last year of production during a term from the last year of production during the preceding term.
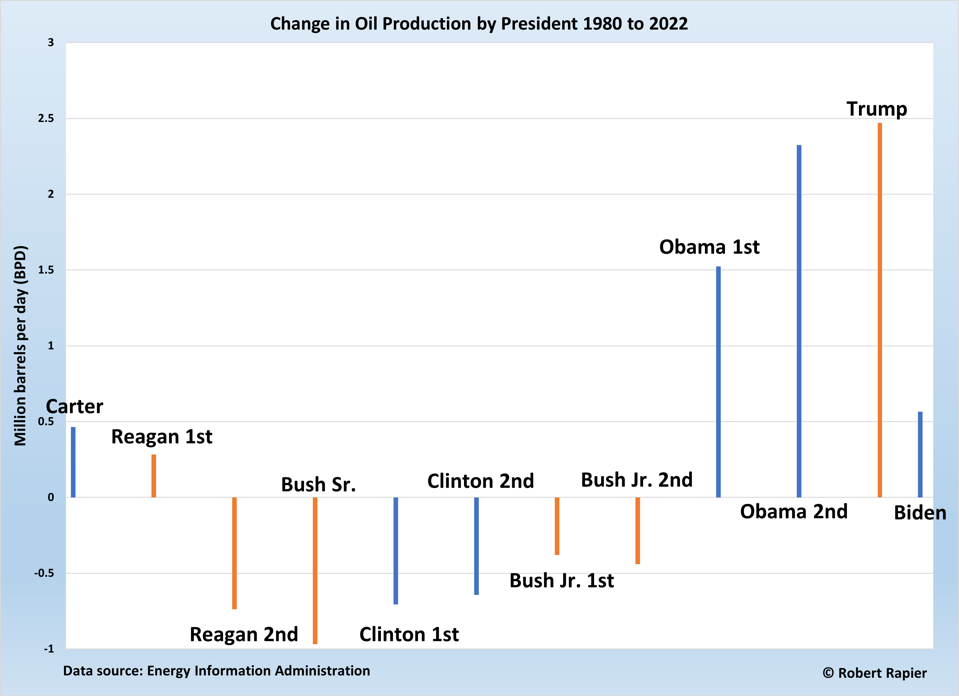
Overall, the largest increase in oil production during any presidential term took place under President Trump (2.47 million BPD). The largest decline — nearly a million BPD — took place under President George Bush, Sr.
The largest increase in oil production during a presidency (two terms) took place under President Obama (3.8 million BPD across both terms). The largest decline during a presidency took place across President Clinton’s two terms (-1.35 million BPD).
Notably, since the fracking boom that developed under President Bush Jr., each presidency has seen an increase in U.S. oil production.
During President Biden’s first two years in office, production has increased by 0.57 million BPD. It’s a pretty safe bet that President Biden won’t reach the levels seen during the Obama and Trump administrations. But it also looks like Biden will extend that streak of production increases that started after President Bush Jr.
Follow Robert Rapier on Twitter, LinkedIn, or Facebook