Every time I address the topic of energy independence, it spurs a lot of interest. But people also get confused about the subject. In the previous article, I addressed a number of questions related to energy independence.
In today’s article, I am going to make it very simple, using just two graphics. You can see all of the data yourself in the Energy Information Administration’s (EIA) Monthly Energy Review.
There are two different ways to think about energy independence. One is that we produce more than enough energy for our needs. In other words, being a net energy producer means you are energy independent. When someone says “We became energy independent under President Trump”, that’s the definition they are implicitly using.
The following graphic shows U.S. net energy exports from 1949 through 2022. It considers fossil fuels, nuclear power, and renewables. When the number is negative, that means we are a net energy importer, and thus not energy independent by this definition. I highlighted several noteworthy events on the graphic.

On the graphic, U.S. net energy exports turned negative in 1953. In other words, we became a net energy importer at that time, and thus lost our energy independence. From 1953 to 2005, the U.S. steadily lost ground, with the exception of when the Alaska Pipeline came into service in 1977. But in 2005, U.S. energy dependence reached its maximum level.
Then the fracking boom changed the graph. Suddenly, net U.S. imports began to decrease each year as the U.S. began producing more oil and gas. The graph turned upward in 2006, and then climbed steadily during President Obama’s two terms. The only inflection during President Obama’s terms was caused by a price war initiated by OPEC in 2014.
But OPEC capitulated a couple of years later, and the graph continued to climb under President Trump. Those who wish to give President Trump credit can see that the climb under Trump was steeper than it was under Obama. If you take the average climb under President Obama and extrapolate it, you would hit zero around 2020 or 2021.
Under President Trump, we hit zero in 2019, and thus became energy independent under that definition. Thus, although it’s not true that President Trump made us energy independent, he probably sped up the timeline. But the trend toward energy independence had already been going for a decade.
Likewise, by this definition of energy independence, in 2022 we saw the highest level of net energy exports since the EIA’s first data point in 1949. Thus, per the definition that producing more than we consume is equal to energy independence, we achieved that in 2019, but then 2022 was significantly better.
The second definition of energy independence is that we don’t import any energy at all. But under that definition, we haven’t been energy independent since the EIA began recording the data. We have always imported energy, even under President Trump.
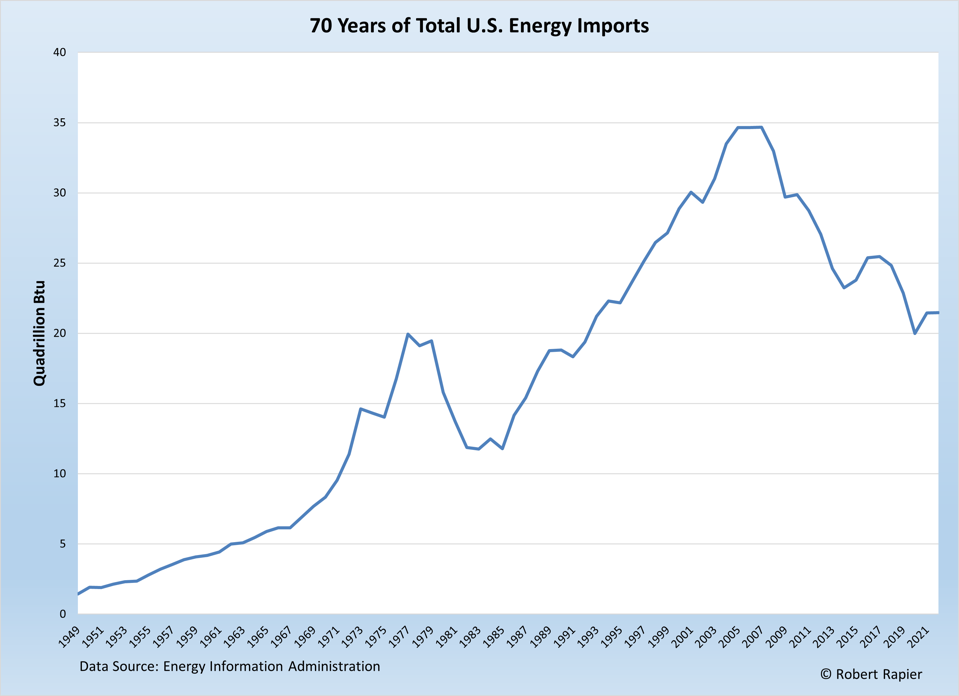
As with the previous graph, imports peaked in about 2005, and then declined as the fracking boom expanded. Again, if you are looking to credit President Trump with something, energy imports did decline for three of four years when he was in office. Under President Obama, energy imports declined in five of eight years.
But crude oil imports, in particular, have been approaching a point in which further significant declines are unlikely, because U.S. refiners prefer certain international crude oils over domestic crude oils. Further, as explained in previous articles, some crude oil is imported simply to refine into finished products and then export them.
Thus, the U.S. is unlikely to ever achieve energy independence based on this definition. Our energy systems will remain entangled with those of the rest of the world.
Follow Robert Rapier on Twitter, LinkedIn, or Facebook