In June 2022, driven by a combination of the Russian invasion of Ukraine, an economic recovery from Covid-19, and arguably certain policies of the Biden Administration, the average weekly retail gasoline price hit an all-time high of $5.07 per gallon. (Source).
Since then, gasoline prices have fallen substantially, and were most recently $3.51/gallon. But I thought it might be interesting to look at the average gasoline price under each president over the past 20 years or so. (Prior to that, gasoline prices were generally under $2.00 a gallon).
Presidents get a lot of credit and blame over rising and falling gasoline prices. In reality, there’s not a lot a president can do to impact gasoline prices in the short term. Longer term, a president can pass policies that impact supply and demand in such a way that they do impact gasoline prices. But in the short term, a president has relatively few handles for influencing gasoline prices.
Nevertheless, a president’s popularity is strongly influenced by what’s happening with gasoline prices. So, let’s take a look at the average gasoline price overseen by each of the past four presidents.
The following graphic shows the average annual gasoline price during each year of the last four presidential terms. Republican presidents are shown in red, Democrats in blue. The numbers come from the EIA, and they represent the average retail price of all grades of gasoline. You can see the raw data here.
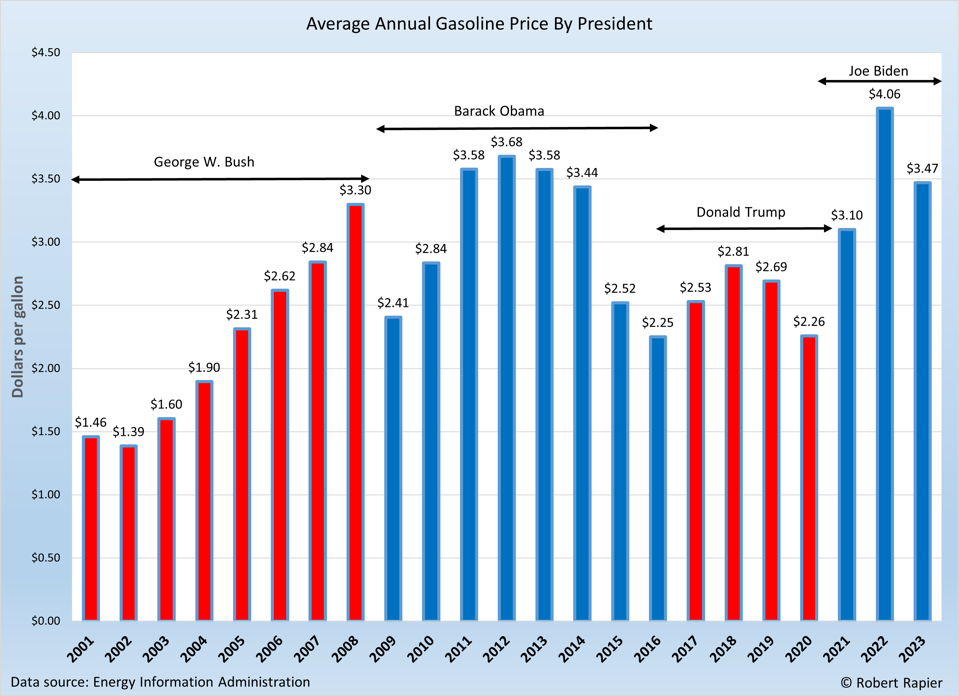
This graphic shows the data, but it needs context. There are many stories that could be spun from a superficial reading of the data, but many of them would be wrong. For example, President Bush saw a huge rise in gasoline prices when he was in office. It would certainly be easy to cast blame on him for this, but President Bush was very pro-oil and gas development.
In fact, the technologies that led to the fracking boom largely developed under President Bush. But fracking didn’t begin to show huge benefits until President Obama’s term.
What happened under President Bush was that Chinese demand grew sharply, and Saudi Arabia was slow to increase production. This led to a widespread belief that global oil production had peaked, and that helped create a bubble in oil prices. That bubble finally burst in 2008 when a recession caused a drop in global oil demand.
Like Bush, Obama initially experienced rising gasoline prices. Those prices reached a peak at the highest annual average to date of any president, before falling back down to the lowest level since Bush’s first term. The reason for the crash in gasoline prices was that Saudi Arabia decided to engage in a price war with the U.S. to win back market share that had been lost to the U.S. shale oil boom.
Thus, most of the rise and fall under Bush and Obama didn’t really have a lot to do with their policies. One could argue that the pro-oil policies under Bush did usher in the eventual glut of oil that happened under Obama, but these are once again long-term policy effects.
Gasoline prices rose during each of President Trump’s first two years in office, reversing the two-year trend that ended Obama’s second term. By Trump’s third year in office, prices fell slightly, but then prices were down sharply in Trump’s fourth year as a result of the Covid-19 pandemic and its impact on oil prices. Gasoline prices in 2020 were at their 2nd lowest level since 2004.
When President Biden came into office, gasoline prices had been rising for several months as the world began to recover from Covid-19. But, demand outstripped supply, and oil prices continued to soar. Then, in early 2022 Russia invaded Ukraine, and that helped propel the average annual gasoline price that year to $4.06/gallon, the highest annual average on record.
Obviously 2023 is incomplete, but so far this year the average annual price of gasoline is $3.47/gallon. That marks a 14.5% decline from 2022, but there’s still a lot of year left.
To date, the average gasoline price during President Biden’s term — with nearly two years still to go — is $3.60/gallon. That is on a pace to be the highest average under any president. Here is how prices stack up per gallon, from lowest to highest average for their terms:
- Joe Biden (partial term) — $3.60
- Barack Obama first term — $3.12
- Barack Obama second term — $2.95
- George W. Bush second term — $2.77
- Donald Trump — $2.57
- George W. Bush first term — $1.59
So, you can see how someone could argue that Republicans are better for gasoline prices. Presidents Bush and Trump were the only presidents that oversaw average gasoline price below $3.00/gallon for four consecutive years of a term.
But the truth is more nuanced than that. The technologies that led to the fracking boom were developed under a Republican president. That, in turn, is responsible for much of the ups and downs in the price over the years. But, Saudi Arabia/OPEC and the Covid-19 pandemic and subsequent recovery also had a huge impact. These factors were largely outside of a president’s control.
In the next article, I will discuss the evolution of oil production during each president’s term. President Obama presided over the largest expansion of oil (and gas) production in U.S. history. But, as with gasoline prices, context is important.
Follow Robert Rapier on Twitter, LinkedIn, or Facebook
5 thoughts on “Average Gasoline Prices Under The Past Four Presidents”
Comments are closed.